Time to Talk Tax Abatements
12 Apr 2018By Stacey Mosley & Jon Tehrani
Mayor Kenney’s suggestion to raise property taxes (for what would be the 5th time in 10 years) during his annual budget address a few weeks ago added fuel to the number of conversations and speculation about the future of the city’s 10 year tax abatement program.
For those unfamiliar, Philadelphia originally implemented a program during the late 1970s which allowed for a 30 month tax abatement on new construction properties. In 2000, the program evolved to include a 10 year abatement for all qualified improvements to real property, terms which still apply today1.
Critics of the program argue that the abatement primarily benefits wealthy residents within Center City, further deprives an already financially strained school district, as well as “question the wisdom and fairness of continuing to exempt new construction while other properties get a tax hike.”23
Proponents of the program, such as the Building Industry Association of Philadelphia (BIA), argue otherwise and suggest the program is responsible for a 376% increase in overall homebuilding activity within Philadelphia since implementation. The first properties to benefit from the program in 2000 started paying taxes on those improvements in 2010. Consequently, the annual tax revenue from abated properties increases each year as more and more age out of the program. It is estimated that properties receiving the abatement will contribute $169.4 million additional dollars to the city’s tax revenue in 2026 (and every year after) once the current abatements expire.4
Clearly, the issue is complicated, not to mention exceptionally important because of the potential impact associated with maintaining the status quo or modifying the program. Which is why we wanted to contribute to the discussion, and use FixList’s hyperlocal data platform to add nuance to existing analysis as well as address a few areas where data gaps exist. More specifically, this mini-report will answer the following questions:
- How has the abatement been leveraged for the development of commercial and industrial properties compared to residential?
- How much of the total abated value is for truly luxury units?
- Where has the abatement for light residential properties had an impact?
Methodology
For the purpose of this analysis we looked at the exempt building values for properties issued and completed new construction or major renovation permits since 2007. Major renovations included major alterations, additions, and partial demolitions. While access to the exemption codes from the Office of Property Assessment specific to abated properties would allow for a more precise modeling, these were unfortunately not available at the time of analysis.
How has the abatement been leveraged for the development of commercial and industrial properties compared to residential?
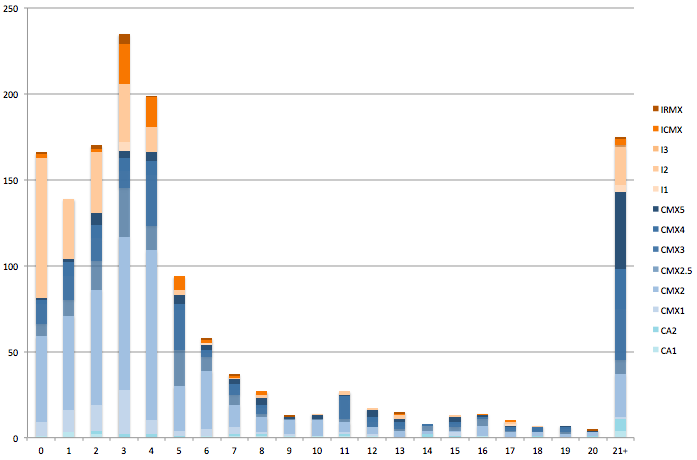
Though 84% of properties leveraging the tax abatement are residential, commercial and industrial properties were found to have used the abatement, too. Indeed, there is a total of $3.58 billion in active abatements for commercial or industrial properties having completed major or new construction since 2007. Most of these abatements apply to new construction as opposed to renovations. Of the sample analyzed, the relative amount of new construction for Heavy Commercial/Industrial Mixed-Use (83%), Medium Industrial Use (81%), and Special Institutional Use (79%), far outpace the city-wide average (62%). When it comes to dollar amounts, 62.7% of abated commercial and industrial properties were exempt for less than $500,000. Approximately 21.5% are abated for over $1,000,000, with 12% over $2,000,000.
Table 1: Percent of Currently Abated Properties with Major Renovations vs. New Construction
| Zoning | Major Renovation | New Construction | Zoning | Major Renovation | New Construction |
|---|---|---|---|---|---|
| SPPOA | 100% | 0% | RM3 | 29% | 71% |
| SPINS | 21% | 79% | RM2 | 24% | 76% |
| SPENT | 0% | 100% | RM1 | 38% | 62% |
| RTA1 | 69% | 31% | RDS1 | 0% | 100% |
| RSD3 | 55% | 45% | IRMX | 50% | 50% |
| RSD2 | 0% | 100% | ICMX | 17% | 83% |
| RSD1 | 51% | 49% | I3 | 100% | 0% |
| RSA5 | 37% | 63% | I2 | 19% | 81% |
| RSA4 | 30% | 70% | I1 | 36% | 64% |
| RSA3 | 39% | 61% | CMX5 | 89% | 11% |
| RSA2 | 29% | 71% | CMX4 | 75% | 25% |
| RSA1 | 24% | 76% | CMX3 | 50% | 50% |
| RMX3 | 75% | 25% | CMX2 | 36% | 64% |
| RMX2 | 77% | 23% | CMX1 | 52% | 48% |
| RMX1 | 50% | 50% | CA2 | 32% | 68% |
| RMC | 0% | 100% | CA1 | 50% | 50% |
| RM4 | 90% | 10% | CMX2.5 | 46% | 54% |
Chart 2: Industrial/Commercial Properties Abated by $100,000 Brackets (Major or New Construction)
How much of the total abated value is for truly luxury units?
Shifting to residential properties, let’s explore the properties in the city with the highest total exemptions. The detrimental impact of single properties with exorbitant exemption amounts is a topic often included in discussions related to the tax abatement program, contributing to the perception that the program disproportionately benefits luxury high rise buildings in Center City. As Table 3 shows, however, solely evaluating a property on the basis of the total exemption can sometimes lack context, especially in the case of multi-unit residential buildings. For example, examining the exempt values on a per unit basis reveals amounts comparable with most light residential exemption amounts throughout the city.
Table 3: Apartment Buildings with Total Exemptions over $50M
| Site Address | Last Sale Date | Total Exempt | Unit Count | Avg. Per Unit Abated Value |
|---|---|---|---|---|
| 2116 CHESTNUT ST | 7/31/15 | $128M | 321 | $397,657 |
| 1213-19 WALNUT ST | 9/28/15 | $116M | 322 | $360,278 |
| 1919-43 MARKET ST | 1/19/11 | $112M | 321 | $350,394 |
| 1900-24 ARCH ST | 9/29/14 | $109M | 234 | $463,940 |
| 1901-39 CALLOWHILL ST | 3/29/12 | $106M | 288 | $366,707 |
| 2026-58 MARKET ST | 2/25/11 | $85M | 282 | $301,307 |
| 1801 JOHN F KENNEDY BLVD | 11/30/95 | $65M | 570 | $114,661* |
| 1100 W MONTGOMERY AVE | 7/25/12 | $59M | 238 | $247,145 |
| 1112-28 CHESTNUT ST | 10/1/13 | $55M | 112 | $495,359 |
| 4700 CITY AVE | 1/20/05 | $52M | 276 | $189,596* |
| 777 S BROAD ST | 6/13/08 | $52M | 146 | $356,141 |
*Renovated existing structure
Where has the abatement for light residential properties had an impact?
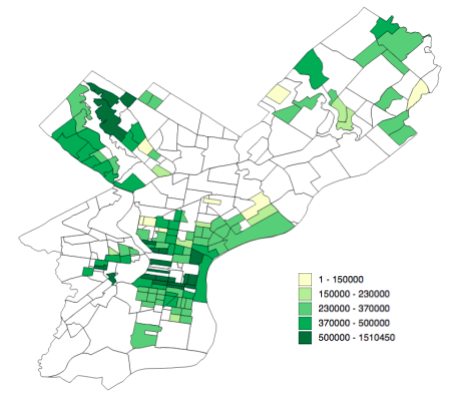
Based on the sample data, Map 4 below shows the median exempt building value for new construction, light residential homes benefitting from the tax abatement program having sold since 2015. Except for the core of the city and the parts of the Upper Northwest, the median abated values are in the $230,000 to $370,000 range. Overall, 87% of the light residential zoned properties in the sample for this analysis have an abatement of less than $500,000.
Map 4: Median Abated Amount for Light Residential New Construction Sold Since January 2015 by Census Tract
In Conclusion
Catalyzing development in Philadelphia was arguably the primary motivation for implementation of the 10 Year Property Tax Abatement Program and the data clearly indicate that to date the program has been successful in realizing this goal.
Unanswered questions still remain, however, which require more in-depth analysis and subsequently are beyond the scope of this report. For example, does the same need for a tax abatement program exist as in 2000 when the current format was adopted? If the abatement program is modified, how do we ensure the areas which have yet to benefit are able to do so?
We expect this to be an ongoing discussion and are curious to see what the future has in store for the program.
Want to participate in the discussion as well?
You have access to the same data we do! Sign up for a FixList account and dive in today.
Sign Up
Footnotes
1: For example, if you own a property that is assessed for $50,000 and make $25,000 worth of qualified improvements, you would be eligible for an exemption and not have to pay taxes on the additional $25,000 in improved value for ten years. You would still pay taxes on the original $50,000 in assessed value.
2: Adelman, Jacob. Tax Break for new Philadelphia Construction comes under financial watchdog’s sights. Philadelphia Inquirer. March 2018.
3: A tax hike would still apply to the unimproved land and building value of the property. For instance, if an abated property is worth a total of $500,000 - $100,000 for the land and $400,000 in abated improvements - a property tax increase would still apply to the $100,000 in land value.
4: Gillen, Kevin. Philadelphia’s 10 Year Property Tax Abatement. Building Industry Association of Philadelphia. March 2017.