L.L.C. and L.P. Ownership in Philadelphia
18 Jul 2018by Jon Tehrani
National data indicate ownership rates for L.L.C.s and L.P.s are on the rise. According to a recent report1 in the New York Times, approximately 9% of single-family home sales in 2017 were to L.L.C.s (double the amount from a decade ago) and as of 2015, L.L.C.s and L.P.s owned about ⅓ of all rental properties on the market.
Limited Liability Corporations (L.L.C.) and Limited Partnerships (L.P.) represent popular mechanisms for property ownership within the real estate industry because of benefits such as pass-through taxation, personal liability protection, flexible management structures, facilitation of foreign investment in domestic real estate, and more. In short, L.L.C.s and L.P.s are legal entities which provide the liability protection of a corporation without as burdensome tax regulation.
While the structure of an L.L.C. or L.P. arrangement may be positive for the stakeholders, there are downsides to the model that can affect other parties and the housing market more broadly. For example, L.L.C.s and L.P.s often provide less transparency in regard to ownership, which can make it challenging for a city to collect back taxes or for nearby neighbors to identify whom to contact when maintenance issues occur. Furthermore, L.L.C and L.P. investment does not always come with physical change. Of the 4,144 plots of vacant land purchased in Philadelphia by tax partnerships since 2012, only 19% have seen new construction. The remaining 81% has remained vacant land.
Curious to better understand the local extent and impact of L.L.C. and L.P. property ownership, Stepwise conducted exploratory analysis and compiled the results into a high-level overview of the market. Keep reading for answers to questions such as:
- How many properties in Philadelphia are owned by a tax partnership?
- Which are the top 10 neighborhoods in Philadelphia for Single Address L.L.C.s?
- Can year-over-year sales involving an L.L.C. or L.P. represent a proxy for development interest at the submarket level?
Methodology
The basis for this analysis is an extract from the citywide assessment dataset maintained by the Office of Property Assessment (OPA), created by using the owner name to identify properties owned by a Limited Liability Corporation (L.L.C.) or Limited Partnership (L.P.). The data in the extract (and subsequent analysis) is current as of July 16th, 2018.
You, too, can access this information and more through the Stepwise platform. Try it now
36,904 L.L.C. or L.P. Owned Properties and Counting
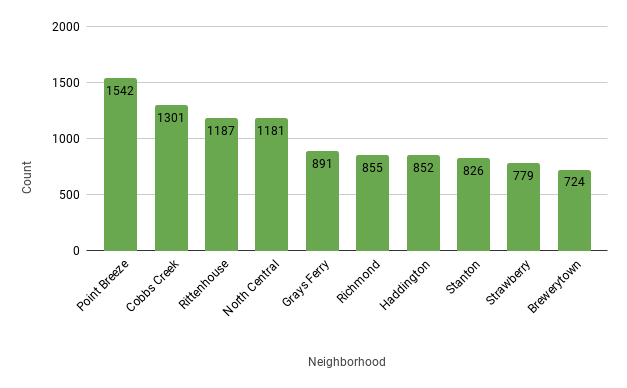
Currently, a total of 15,710 L.L.C.s or L.P.s actively invest in Philadelphia and own an estimated 36,904 properties. 66% of the subject properties have a residential base zoning, with Single Family Homes (RSA-5) composing the majority share at 40.7%, and Multi-Family (RM-1) representing the next largest share at 25.3%. 10,138 (27.4%) of these properties are located in just ten neighborhoods as seen below in Figure 1.1.
Figure 1.1 - Top 10 Neighborhoods for L.L.C. or L.P. Property Ownership
To account for disparities in neighborhood size and density, Table 1.1 below shows the ownership of property by an L.L.C. or L.P. in proportion to ownership of all properties for the same ten neighborhoods.
Table 1.1 - Percent of Total Properties Identified as Owned by an L.L.C. or L.P. by Neighborhood
| Neighborhood | % |
|---|---|
| Point Breeze | 15.5% |
| Cobbs Creek | 9.4% |
| Rittenhouse | 12.8% |
| North Central | 18.4% |
| Grays Ferry | 13.7% |
| Richmond | 6.6% |
| Haddington | 9.8% |
| Stanton | 13.1% |
| Strawberry Mansion | 8.2% |
| Brewerytown | 13.9% |
Single Address L.L.C.s: One of a Kind
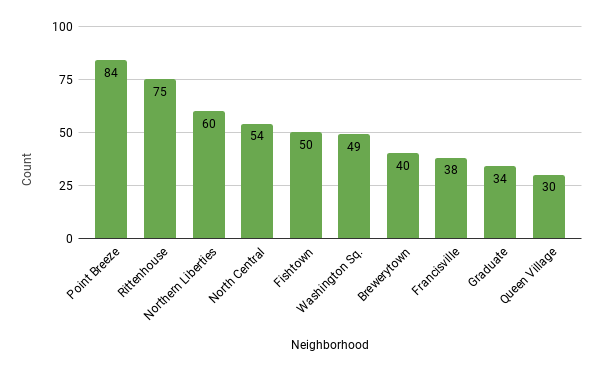
One interesting phenomenon relevant to the discussion of L.L.C. and L.P. property ownership is the Single Address L.L.C., effectively a legal entity whose name matches the address of the subject property exactly (e.g. 224 Carson Street and 224 Carson Street L.L.C.). Currently, there are 1,469 Single Address L.L.C.s or L.P.s within Philadelphia.
Figure 2.1 below highlights the top ten neighborhoods for Single Address L.L.C. ownership. While there is some overlap, this list is different than the previous top ten list of total L.L.C. or L.P. ownership and features the most active submarkets of this decade, such as Point Breeze, Northern Liberties, Fishtown, Francisville, Brewerytown, Graduate Hospital, and Queen Village. While the exact reason for the disparity remains unclear, one hypothesis may be that these entities are more focused on short-term redevelopment as opposed to longer-term speculation.
Figure 2.1 - Top 10 Neighborhoods for Single Address L.L.C. or L.P. Owned Properties
Between 2013 and 2017, Sales Involving an L.L.C. Increased 473% in Brewerytown
One of the benefits of access to granular, hyperlocal data is the ability to experiment with creating unique, custom metrics. For example, tracking year-over-year property sales involving an L.L.C. or L.P. as a potential proxy to gauge interest in development at the sub-market scale.
Unlike most homebuyers who purchase a property with a down payment and a 15 or 30 year mortgage, participants in tax partnerships often seek a faster return on investment and subsequently place their capital in rapidly appreciating sub-markets. Therefore, monitoring year-over-year sales for instances of significant change might identify areas of current or near future interest.
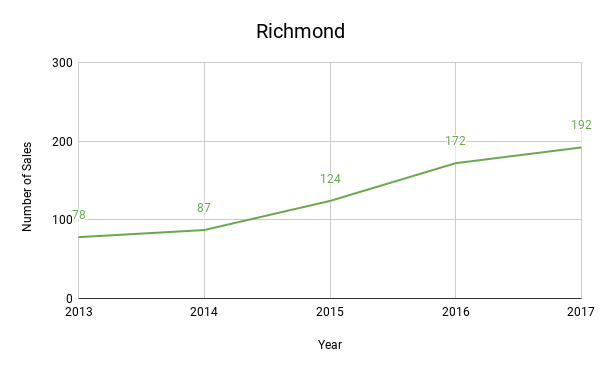
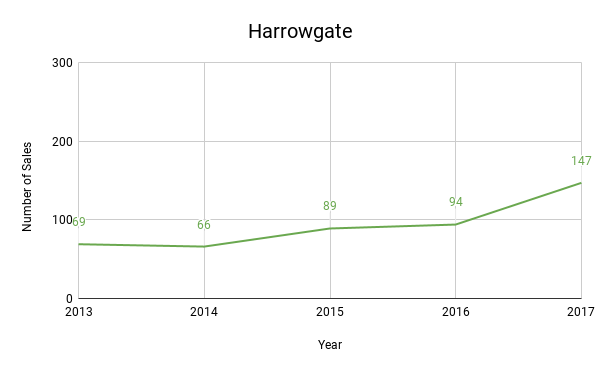
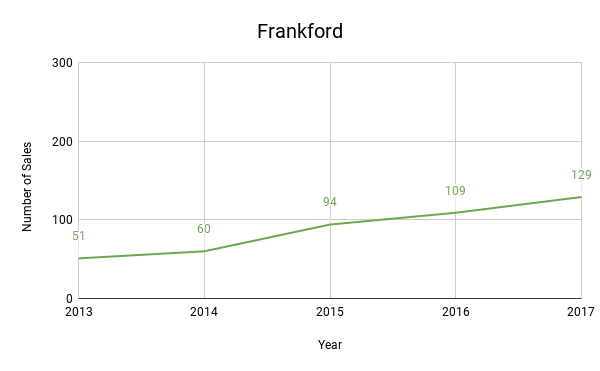
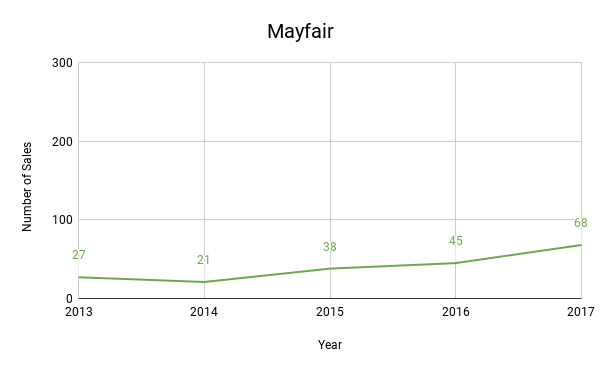
Between 2013 and 2017, many neighborhoods experienced a rapid increase in the number of annual sales involving an L.L.C. For example, Brewerytown realized a 474% increase, Strawberry Mansion realized a 375% increase, Frankford realized a 153% increase, and West Kensington realized a 794% increase.
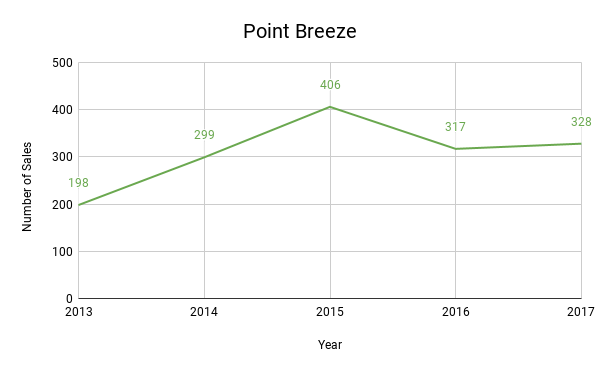
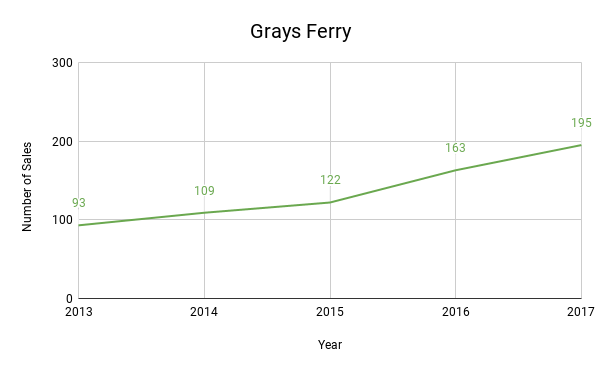
The charts below are also helpful to identify potential saturation points for specific submarkets. For example, Fishtown and Point Breeze both experienced down years in 2017, whereas submarkets adjacent to each (e.g. East/West Kensington, Richmond, Grays Ferry) maintain a steadily increasing upward trajectory, indicative of a market pressure spillover effect.
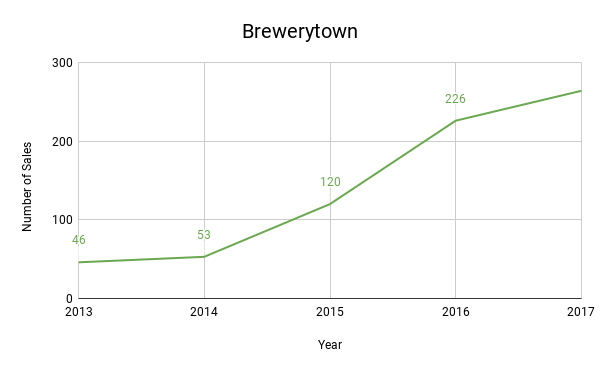
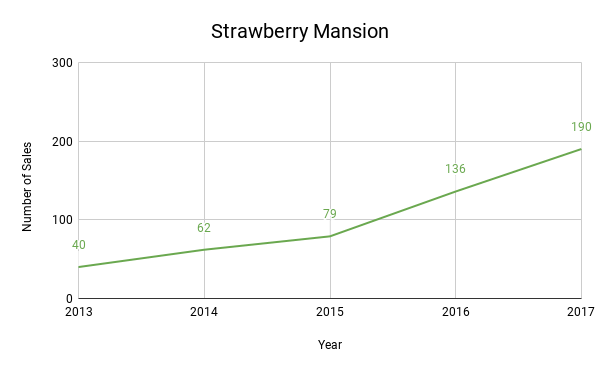
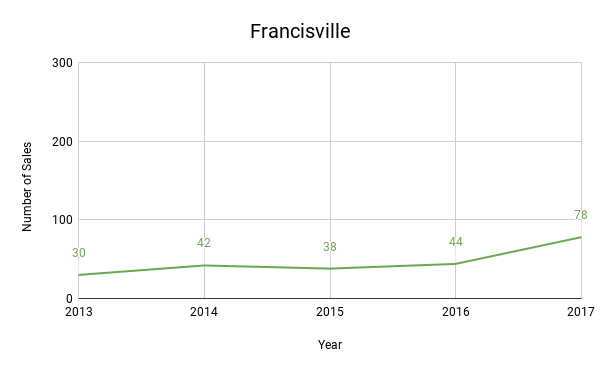
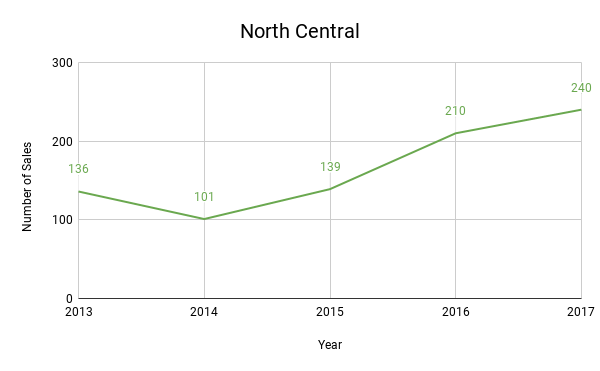
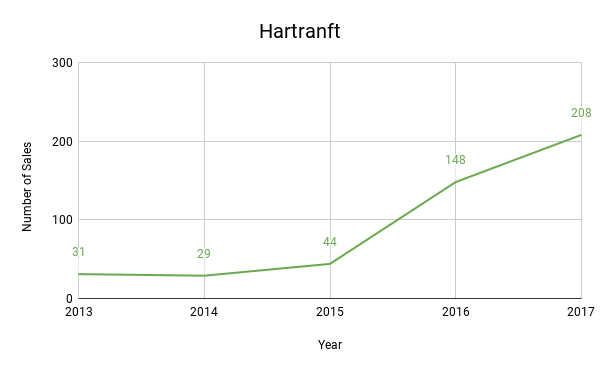
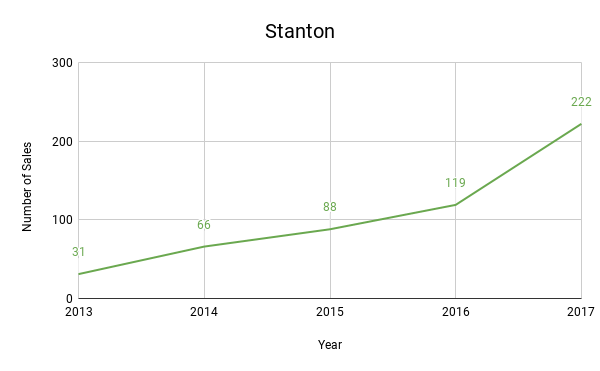
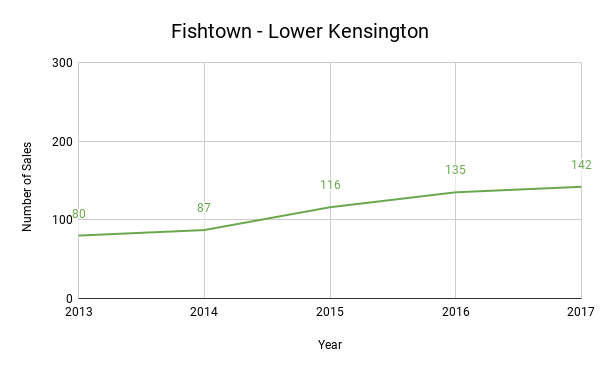
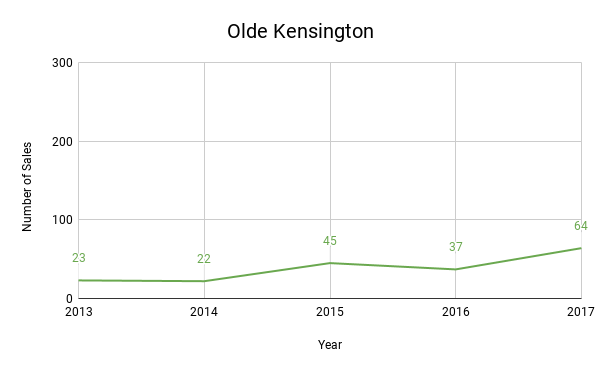
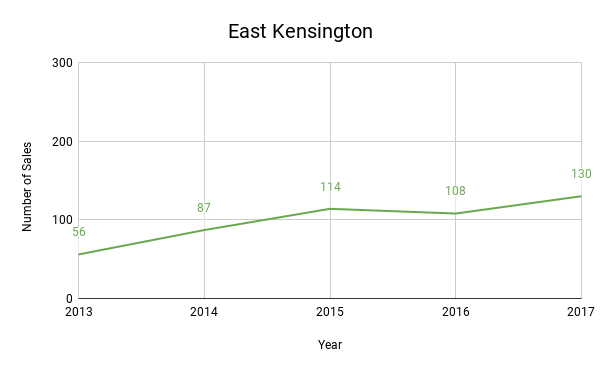
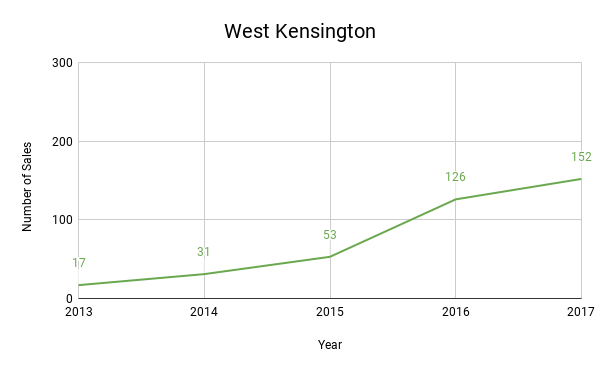
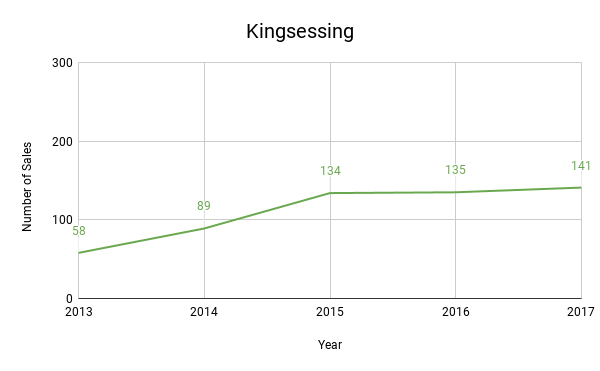
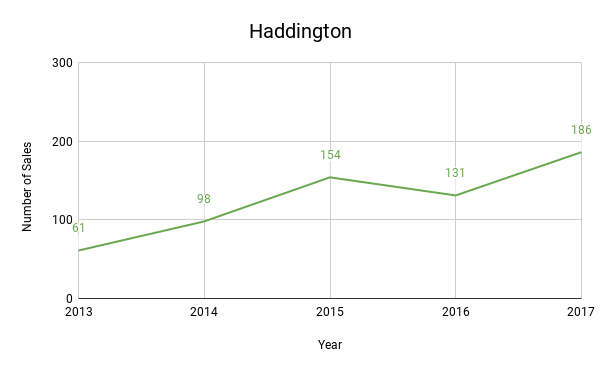
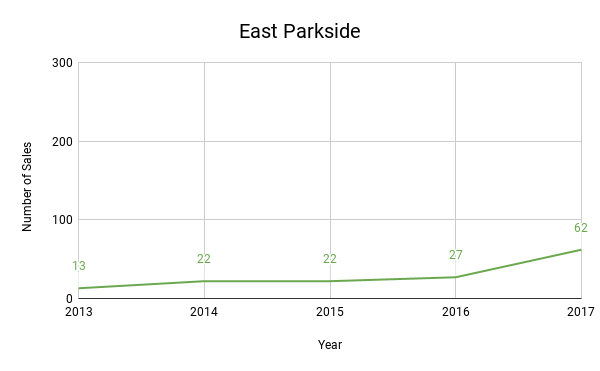
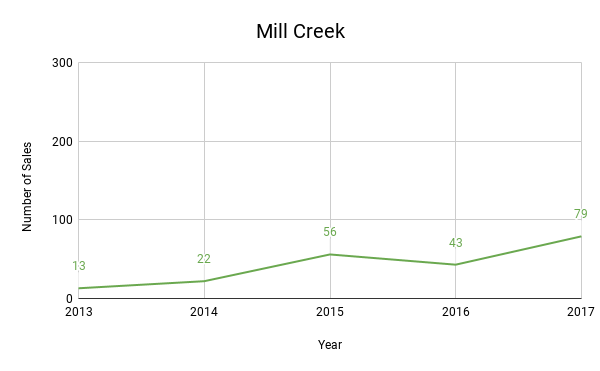
Because our data streams refresh daily, we’re also able to look at progress in 2018 so far. A little more than halfway through the year, the following submarkets have already surpassed their 2013 full-year total: Brewerytown (96), Strawberry Mansion (108), Hartranft (90), West Kensington (66), and Mill Creek (32).
Conclusion
This report facilitates an introduction to L.L.C. and L.P. property ownership in Philadelphia as well as a foundation for future research. The purchase of properties by tax partnerships is on the rise in various submarkets. To explore this data and conduct similar analyses, check out the Stepwise platform and use the ownership filter in our advanced search interface! Try it now
Questions? Send us a note at hello@trystepwise.com for more information on how to implement the search on your end and if you haven’t yet, use the following link to get started with a free account today.
Footnotes
1: Badger, Emily. Anonymous Owner, L.L.C.: Why It Has Become So Easy To Hide In The Housing Market. New York Times. April 2018.