Crunching the Numbers: Opportunity Zones
03 Sep 2018A joint report by: Greg Goldstein & Stacey Mosley
Opportunity Zones have received a lot of attention in recent months. Tacked on to the Tax Cuts and Jobs Act in December 2017, this federal tax incentive program encourages impact investments in distressed rural and urban neighborhoods across the U.S., leveraging capital gains realized on existing investments.
So how does the program work?
Based on metrics like poverty and job accessibility, each state was granted the ability to designate one quarter of its qualified Low-Income Community census tracts as Opportunity Zones. Low-Income Community tracts have the following characteristics:
- Poverty rate of at least 20%, or
- Median family income not exceeding 80% of the statewide median family income (if located outside of a metropolitan area), or
- Median family income not exceeding 80% of the statewide median family income or the metropolitan area median family income, whichever is higher.
Of the 300 Opportunity Zones in Pennsylvania that will receive these investment benefits, 82 are located in Philadelphia. In these tracts, investments in assets through a self-certified “Opportunity Fund” are eligible for a tiered system of tax benefits based on the duration of investment:
- 1-10+ year hold: All prior capital gains reinvested in an Opportunity Zone through an Opportunity Fund within 180 days of the capital gains event will receive capital gains deferment until the earlier of the sale of the Opportunity Zone property or December 31st, 2026.
- 5-7 year hold: A 10% exclusion of reinvested capital gains from taxation.
- 7-10 year hold: An additional 5% exclusion from taxation, bringing total exclusion to 15%.
- 10+ year hold: A 15% total exclusion of original capital gains from taxation plus permanent exclusion of any gains earned from the Opportunity Fund investment.
Given the long-term nature of investments through the Opportunity Zone program, the greatest benefits will only apply to buy-and-hold properties, rather than shorter-term new construction and fix and flip sales. This has huge implications for Philadelphia, which sports a burgeoning residential rental market and a deep portfolio of industrial and commercial properties.
Figure 1: Designated Opportunity Zones in Philadelphia
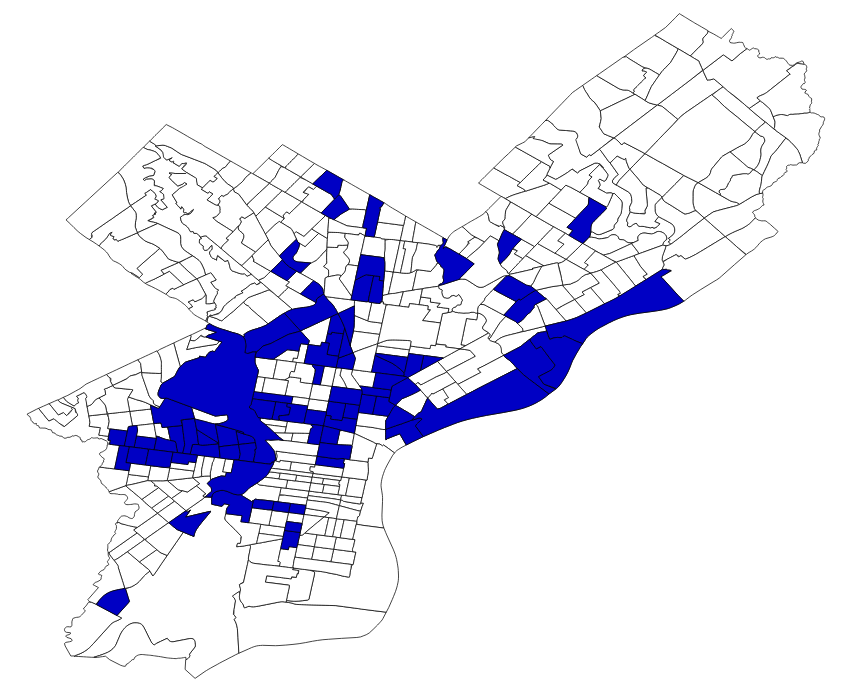
Geographically, prime locations for industrial and commercial redevelopment are clustered northeast of Center City - primarily along the Riverwards, in addition to West Kensington, and Callowhill - benefitting from the proximity to mass transit for commuters and the I-95 corridor. Table 1 highlights the distribution of the 334 vacant medium to high density commercial or industrial properties with over 5,000 square feet in land area.
Table 1: Top 5 Neighborhoods for Vacant Ind/Com Properties Over 5,000 sqft of Land
| Neighborhood | Count |
|---|---|
| Richmond | 34 |
| Callowhill | 20 |
| Tacony | 18 |
| Bridesburg | 17 |
| West Kensington | 15 |
| City of Philadelphia Total | 334 |
Variables such as the number of new construction projects nearby, available square footage and rate of appreciation in the area around each investment will prove instrumental in targeting specific properties. This information and more is available now in our Stepwise Premium Reports.
If the implementation of previous new market tax incentives is any indicator, the regulations on what types of investments qualify for Opportunity Zone tax benefits will prove to be much more restrictive with business financing and commercial renovations than with residential ventures. Opportunity Zone investments in commercial and industrial properties will likely be deferred until the Treasury releases more rules anticipated this Fall.
A Closer Look at Residential Investments
Regarding the residential market, it’s important to understand the rental landscape in Philadelphia’s newly minted Opportunity Zones given the long-term holding implications of the program. Across the 82 designated Opportunity Zone census tracts in Philadelphia, there are over 109,977 light residential properties, encompassing over 25 Million square feet of vacant land. That’s almost 19% of all properties in the city.
With so many properties, where does one begin narrowing in to find the right assets for investment?
To start, it would be helpful to evaluate real estate in Philadelphia based on the type of residential market each neighborhood is currently best suited to support. We do this by tracking the average and highest percentile values of sale price per square foot by asset type across the city. As a baseline, we can segment the market given the estimated cost of construction per square foot for residential properties and see where sale prices support fix-and-flip projects and where sale prices do not. For the purposes of this analysis, we assume the following:
- New Construction / Fix & Flip Markets: $120/sqft and over
- Strong Rental Market: $65/sqft - $120/sqft
- Weak Rental Market: Under $65/sqft
As seen in Figure 2, of the designated census tracts outlined in blue, the price per square foot distribution highlights regions of the city as currently being the strongest rental markets in yellow and in green where the market is also supporting the cost of new construction already as well. One can also see which of the weaker designated tracts in red are tangential to these stronger micro-markets.
Figure 2: Opportunity Zones by Top 10 Percentile Price Per Square Foot Sale Value
(Opportunity Zones Highlighted in Blue)
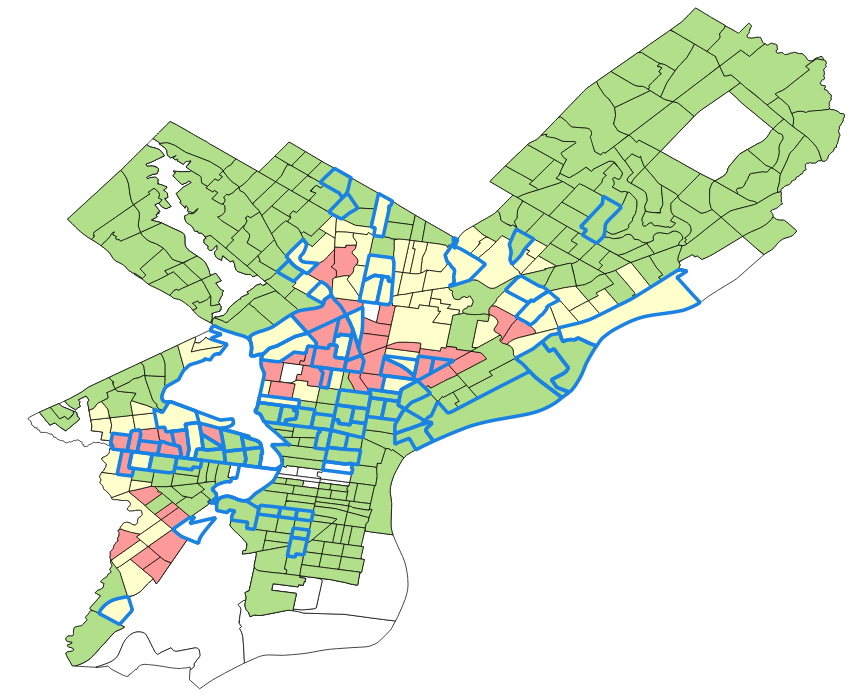
- New Construction / Fix & Flip Markets: Green
- Strong Rental Market: Yellow
- Weak Rental Market: Red
In today’s scenario, we are looking for potential properties for rehab or new construction, so it would be helpful to know where other developers are already beginning to lean into the rental market. Let’s factor in the location of recently purchased and renovated or newly constructed rental properties. Figure 3 shows how these existing rental properties populate across the Opportunity Zones, with the lightest shades having fewer than a dozen renovated rental conversions since January 2013, and the darkest with over three dozen renovated and consequently licensed rentals in the same time frame.
Figure 3: Newly Purchased and Renovated/Newly Constructed Rental Properties
(Opportunity Zones Highlighted in Blue)
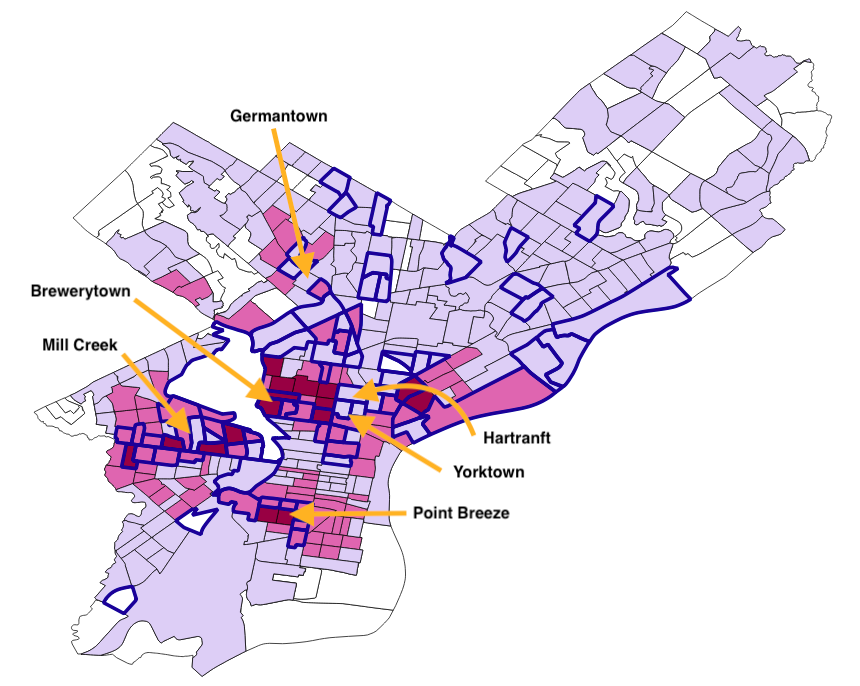
If we compare the two maps above, one begins to see which Opportunity Zones are just beginning to emerge as micro-markets like Mill Creek and Germantown, which have seen pre-incentive activity and will further be further bolstered like Brewerytown and Point Breeze, and which are adjacent and will benefit the most from the long term nature of these investments like Hartranft and Yorktown.
Financial Impact
Now that we have a sense of geographic location, given benchmarks in pricing and renovation-to-rental activity, what would the financials look like for a rental property utilizing investments via the Opportunity Zone program? For the sake of example, Fishtown is a neighborhood that has notably risen in value over the last several years, trading at $218 per square foot on average at the time of this analysis compared to $147 five years prior. That’s a 48% increase in value over the course of five years alone, or 8.1% year over year annually. Neighborhoods like Yorktown have recently begun showing a similar upward trend, once trading between $95 and $110 per square foot on average between 2013 and 2016, but more recently increasing to $159/sqft in the last twelve months.
Suppose one invested $100 into a property in Yorktown today, and the neighborhood experienced a similar annual rate of appreciation as Fishtown. Table 2 assumes a long-term capital gains tax rate of 23.8% percent (federal capital gains tax of 20% and net investment income tax of 3.8%) and breaks down what we can expect from such investment of $100 in one of our target properties in Yorktown, versus an alternative investment.
Table 2: Opportunity Zone Investment Scenario ($100 Invested)
| Holding Period | Annualized Appreciation Rate | Value After Appreciation | Tax Liabilty - Assuming No Tax Incentive | Net After Taxes - Assuming No Tax Incentive | Tax Liability - Assuming Opportunity Fund | Net After Taxes - Assuming Opportunity Fund |
|---|---|---|---|---|---|---|
| 5 years | 8.1% | $147 | $35 | $112 | $33 | $115 |
| 7 years | 8.1% | $172 | $41 | $131 | $37 | $135 |
| 10 years | 8.1% | $218 | $52 | $166 | $20 | $198 |
With additional benefits kicking in afters ten years, there is a much greater discount in tax liability for the investment in Yorktown compared to alternative investments. In practice, of course, this comparison depends greatly upon the trajectory and actual appreciation of the asset.
Looking for investment opportunities in the Opportunity Zones?
Learn more about elligible properties and potential returns in a one-on-one consultation with a Stepwise team member.